No one doubts the vital importance of data analysis in the modern world. The way a company manages its data will impact both its workflows and its decision-making capacity significantly. To cover this urgent need, solutions such as Tableau Pulse have emerged. This stands out as the best ally of data analysts, providing metrics that truly matter. This time, it arrives with general availability and some new features that will become accessible throughout the year. Let’s delve, then, into this powerful tool that promises to revolutionize the data experience.
What is Tableau Pulse?
Tableau Pulse is a data analytics solution built on the Tableau platform. We could say that it is the reinvention of Tableau, now powered by Tableau GPT. The idea is to simplify users’ data experience to a more accessible one. It combines automated and personalized analyses to facilitate decision-making, helping users integrate data into their daily tasks efficiently. It uses natural language and visual formats to present information understandably. Essentially, it is a tool that allows users to access, analyze, and better understand business data.
Tableau Pulse Architecture
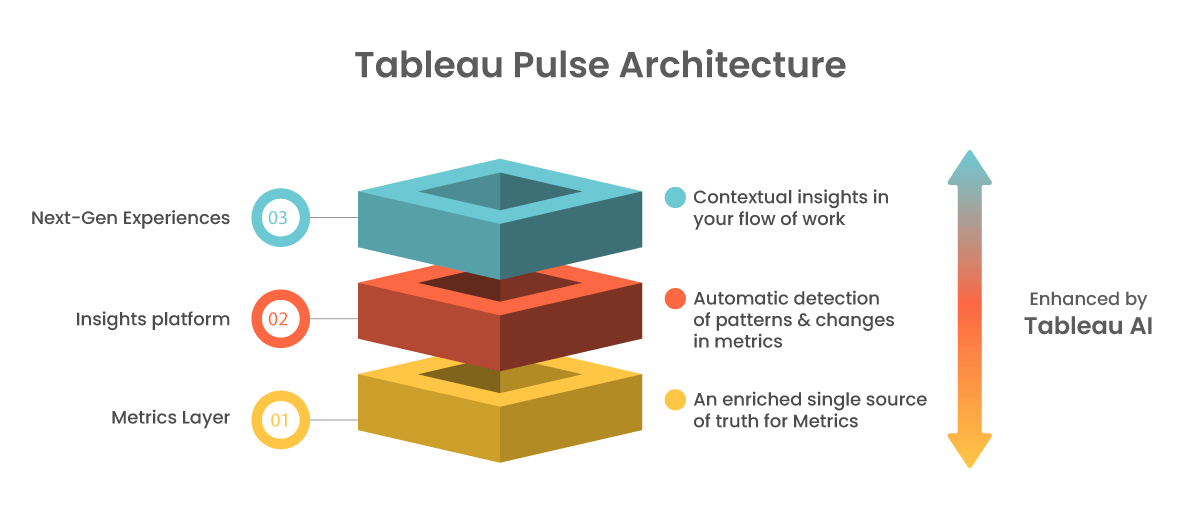
First things first. Before we talk about any of the functionalities of Tableau Pulse, let’s dive into its architecture. This is supported by its Metrics Layer, Insights Platform, Next Generation Experiences, and Tableau AI. These elements form the foundation of the rest of the functionalities since together they provide the ability to consistently analyze throughout the entire workflow.

Metrics Layer
The Metrics Layer is like an important data “dictionary”. Think of it as the place where all the definitions and details of your company’s key metrics are stored. This ensures that everyone understands the metrics in the same way and uses them correctly. For example, it defines what a metric is, how it is calculated, and what it means if it goes up or down. It also establishes how different metrics relate to each other.
In Tableau Pulse, this layer doesn’t just help you understand metrics, but to answer frequently asked questions by users. If someone were to ask “Why did sales decrease this month?”, the platform would answer accurately. In addition, it allows you to customize the metrics according to what each user needs to see. Thus, each area of the company can follow and analyze only the metrics that interest it.
Insights Platform
This platform is like a smart assistant that tells you what you need to know about your Tableau Pulse data. Imagine you are tracking your business metrics and suddenly you receive a message saying: “Hey! Sales of a certain product are going up in the northwest of the country.” That’s an insight, a kind of light that tells you where to look and what to do with your data.
It works through automated data analysis, generating answers, alerts, or suggested actions to frequently asked questions. It is powered by real-time metrics statistical and contextual analyses which are then processed with AI to generate summaries in natural language.
From our perspective, this is a fundamental contribution of Tableau Pulse. Right in your workflow, these insights come to you just when you need them. You no longer have to search through complicated dashboards or reports. They reach you wherever you are, making data-driven decisions easier and faster.
Next generation experiences
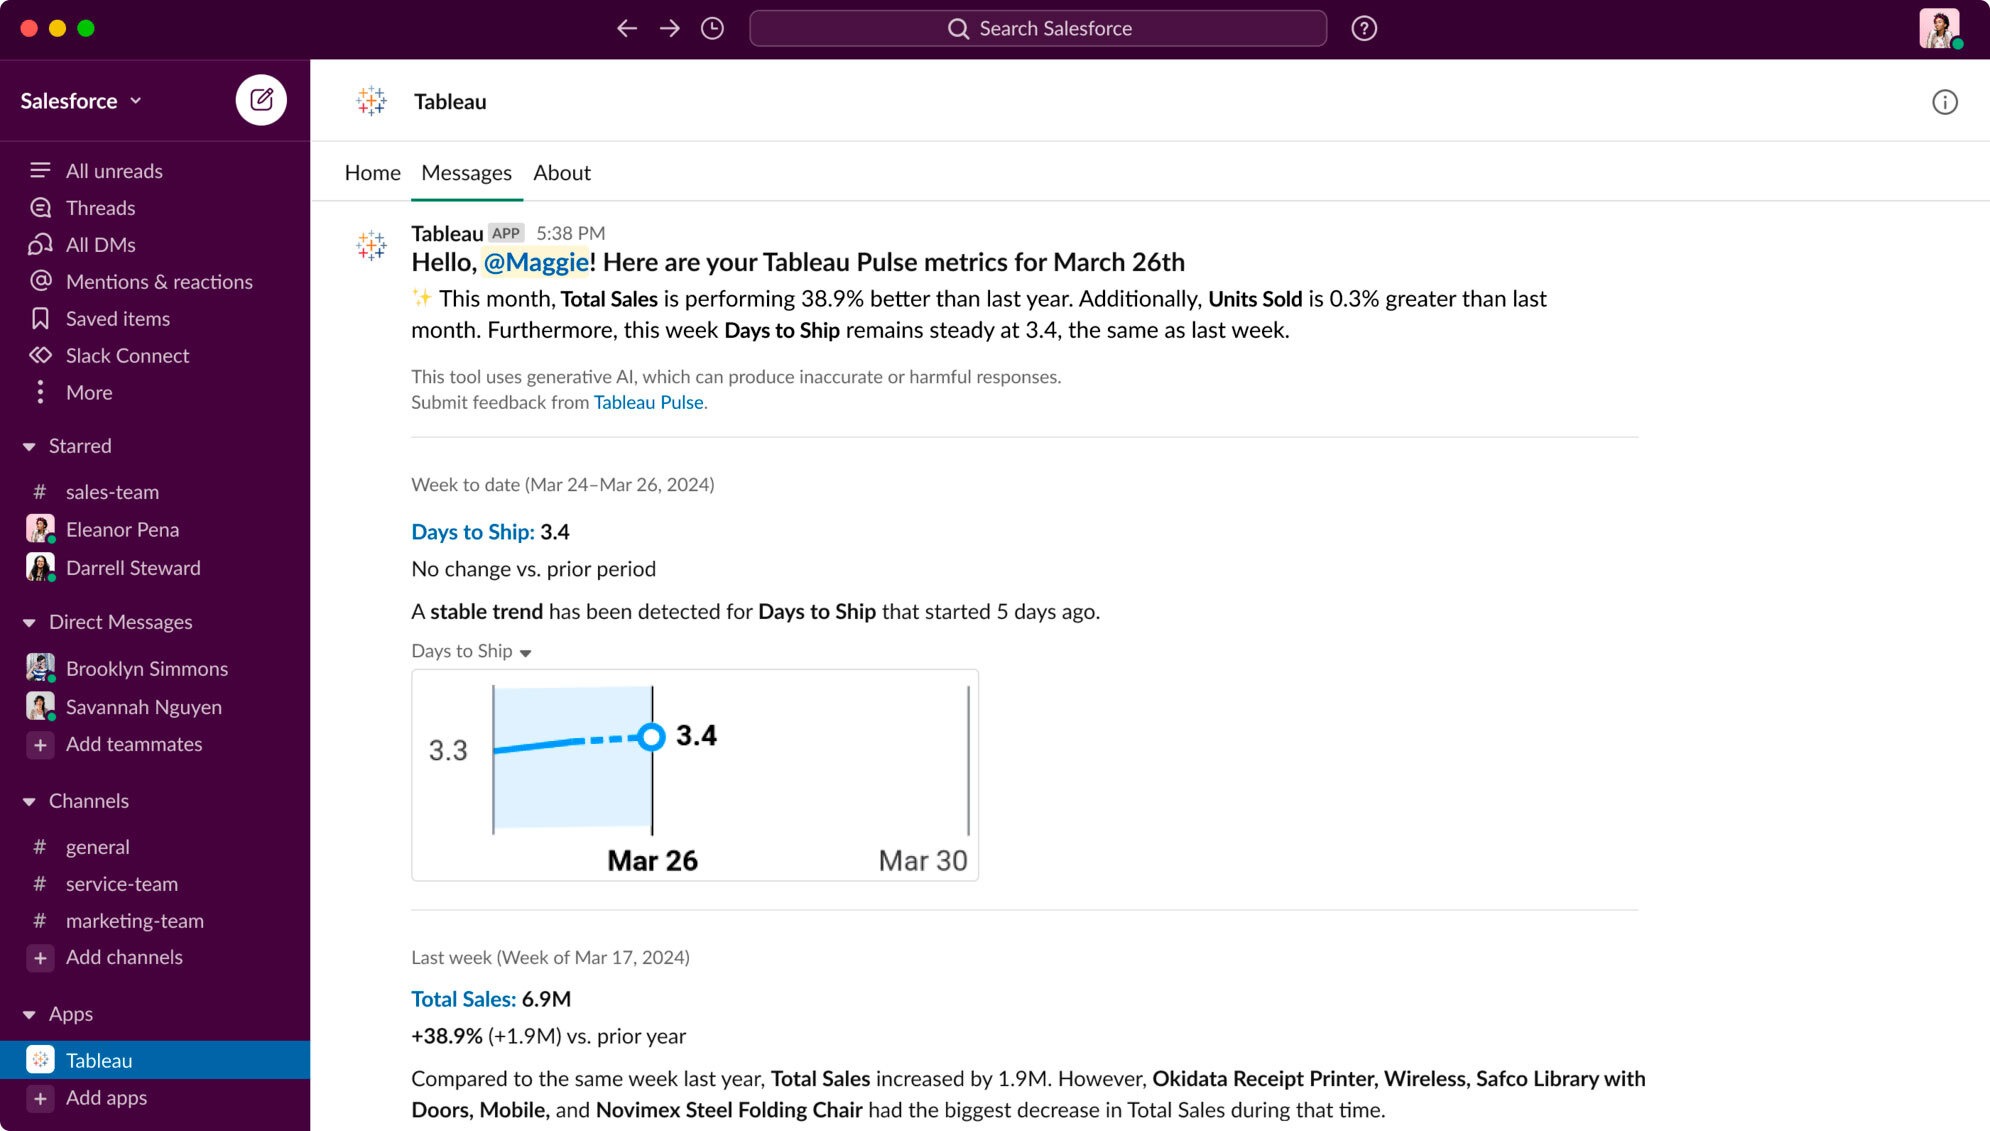
With Tableau Pulse, data analysis reaches a new dimension. Relevant data and information can be accessed in any workspace. Whether you’re in Salesforce, Slack, email, Tableau web app, or another platform. Likewise, it allows users to share and discover relevant metrics with a similar experience to that of social networks. As if that were not enough, Tableau Pulse works proactively. It does not wait for the user to come looking for relevant information, but rather sends it in a timely manner, minimizing potential effects.
Tableau AI
It is worth noting that AI is the spinal cord of Tableau Pulse. As we said at the beginning, this platform is powered by Tableau GPT. However, AI has always been present on the platform since long before GPT. This makes Tableau AI a very comprehensive suite of capabilities that integrates predictive and generative AI. Thus, it allows each process to be intelligently empowered, helping to identify key metrics, understand deep analyses, and proactively anticipate user needs.
Tableau Pulse Features
Throughout the rest of the year, Tableau Pulse will bring new functionalities and features that will change the way specialists manage their data. For example, automated analytics, personalized metrics, and AI-backed advice. With these tools, users will better understand their data, making it easier to identify trends and make faster and more accurate decisions. Some of the most notable are:
Personalized Insights Ranking
It allows you to tell Pulse what information is most important to you. With this feature, you can “like” or “dislike” the insights you receive, which will influence which ones appear first. This way, you will receive insights that best suit your interests and needs, improving your overall experience in the application.
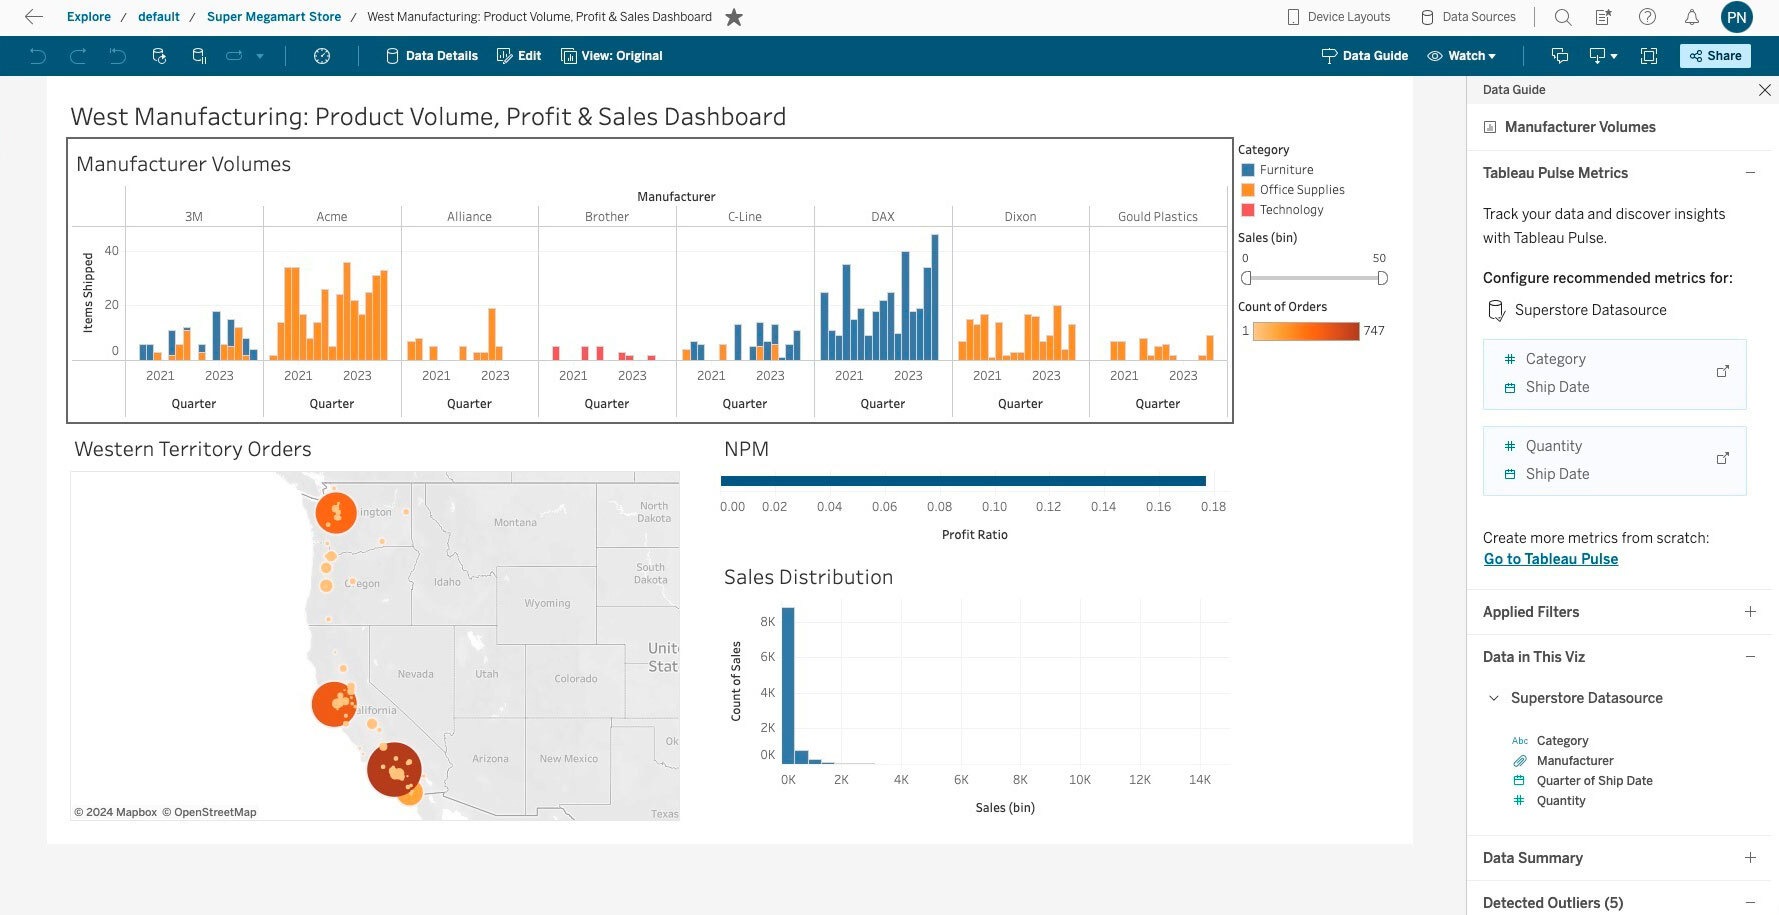
Recommended Metrics
These are useful metric suggestions that come from the visualizations in your Tableau dashboards. You simply select a visualization and receive suggestions for related metrics that might be useful in Tableau Pulse. Then you can fine-tune and formally create them in Pulse. This helps you find important metrics and gives you the freedom to customize them however you want.

Metrics Search
It is a way to find and discover metrics using keywords. It has two main functions: Content Suggestions and Complete Search.
Q&A Enhancements
During the metrics analysis process, Tableau Pulse not only provides guided questions but also incorporates the “Ask” function. When the user utilizes this function, new questions are generated based on the insights investigated.
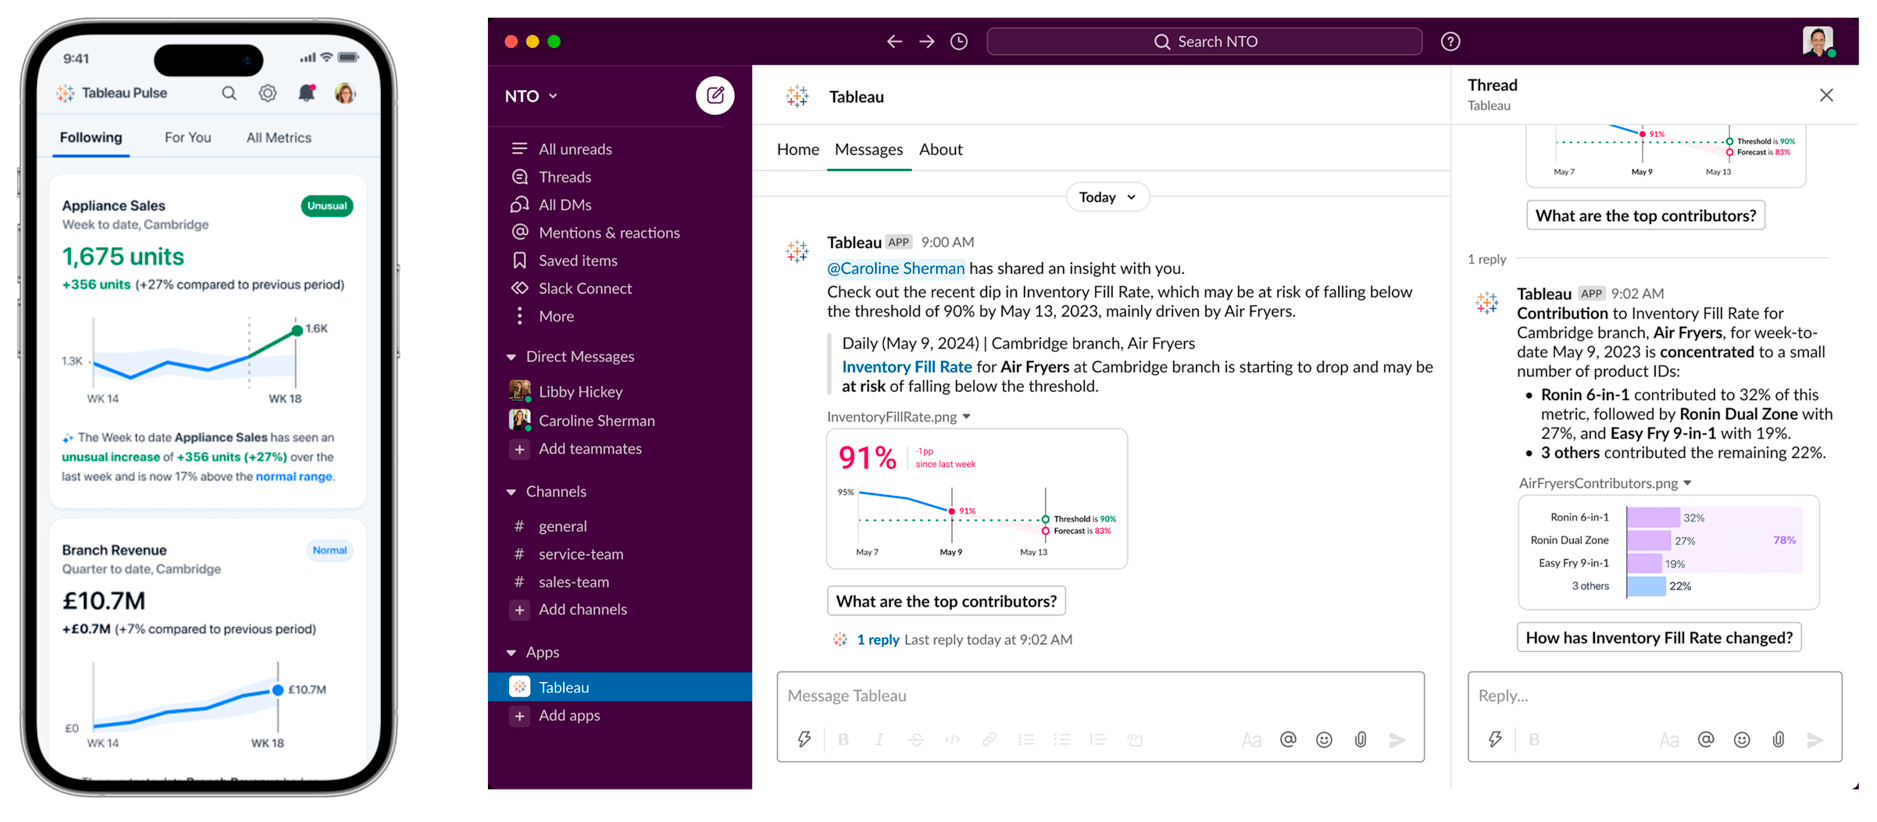
Tableau Pulse on Mobile
Makes it easy to access Tableau Pulse from mobile devices. Consulting metrics and personalized data exploration from the mobile phone will enhance users’ experience in data analysis.

Email Digest and Slack Digest
Tableau Pulse Email Digest and Tableau Pulse Slack Digest are handy summaries of your data delivered directly to your email or Slack, respectively. They give you clear insights into your most important metrics in an easy-to-understand way, with quick AI-generated summaries, charts, and additional details for deeper analysis. In addition, you can customize how often you want to receive these summaries according to your preferences.
Sparklines in Slack
Sparklines are an improvement to Slack Digest. Now you receive insights in plain language accompanied by a graph, helping you easily understand how your metrics change as you work. This way you can quickly see the direction in which your metrics are going and, if they are within expectations, to make appropriate and timely decisions.

Tableau Pulse Web and Lightning Component
The Tableau Pulse Web Component lets you see your key metrics while you work by integrating them into your products or customer applications, allowing you to quickly review your KPIs without interrupting your work. On the other hand, the Lightning Component does the same thing within your workflows in Salesforce, allowing you to see your metrics directly in your processes while you work.
Advantages of Tableau Pulse
The deeper we delve into Tableau Pulse, the more aware we become of its potential. Therefore, we can summarize that among its advantages are:
- Hyper-personalization: Tableau Pulse provides personalized data summaries that can be incorporated into your users’ workflow. These summaries focus on the relevant metrics for each area. Over time, Pulse’s operation should become even more personalized as it understands each user’s interests.
- Data-based decision making: Likewise, it offers accurate information, identifying, in real-time, trends, patterns, and opportunities hidden in the data. This makes making decisions backed by accurate data and deep analysis easier.
- Context-sensitive: Users can access relevant data directly from the tools they already use, such as Slack, email, and the Tableau web app, without moving between different applications.
- Extensive capabilities: Offers automated analysis, custom metrics, guidance through Tableau GPT, interaction in Slack and email, and is compatible with mobile devices.
- Powered Visualizations: Provides attractive and user-friendly visualizations, even for those without mastery of visualization tools.
- Maximized security: Inserted into Salesforce’s suite of AI solutions, the Einstein Trust Layer backs it. The CRM trust layer guarantees trustworthy experiences, based on the ethical use of AI. It employs zero retention agreements, data masking processes, secure recovery, and detection of toxic elements, among other functionalities.
- Easy integration: Finally, Tableau Pulse integrates with the Salesforce ecosystem, including it for free in all editions of Tableau Cloud and with Embedded Analytics.
Tableau Pulse improves the way organizations access, analyze, and use data, enabling more informed and strategic decisions. This combination of advanced technology and accessibility promises to transform how companies interact with and draw on their data. If you want to delve deeper into this powerful tool and its advantages, do not hesitate to contact the SkyPlanner team at hello@theskyplanner.com. We can help you!


