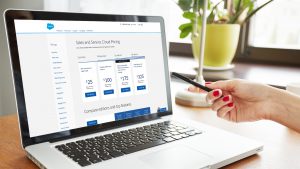
Salesforce Sales dashboards are great tools for taking full advantage of CRM capabilities. The platform allows you to collect all the information about your company, structure reports, generate graphs, and create customizable panels to show key indicators. From these dashboards, the sales team and its managers can monitor the status and trend of these indicators, as well as the behavior of potential customers and business opportunities. In other words, the dashboards allow many statistics to be integrated, providing a compact and useful view of the entire universe of the company. These can assist with making better business decisions, depending on the scenario.
But, is there anything special about 2022? Well yes, there is. As this year is characterized by its high level of uncertainty in the markets at a global level, it requires an agile evaluation of the key indicators of the sales flow, the issuance of early warnings about anomalies, and an effective and flexible business strategy. Here are 7 Salesforce sales dashboards that will go a long way to helping you sustain and grow during this complex journey.
1- Sales Executive Dashboard
Intended for: Managers, Sales Executives
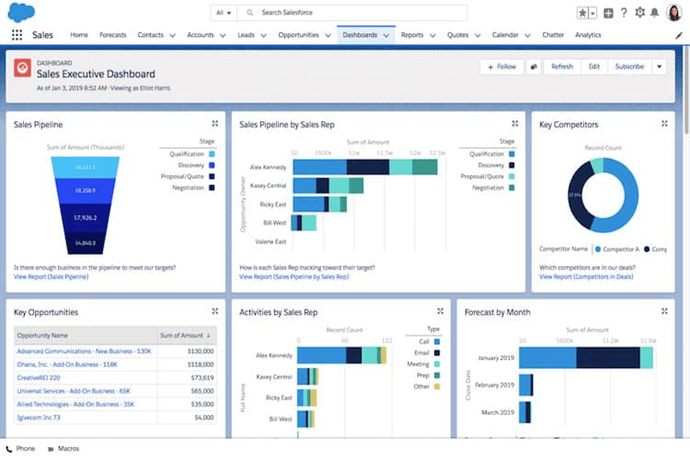
This dashboard shows the flow of sales, both by stages and by sales representatives. It identifies key competitors and opportunities in detail. As the dashboard can display the sales per representative, it provides the ability to assess individual performance and training needs with the greatest potential impact. The complementary information by type suggests how to reorient your commercial policy, and the monthly forecast makes it possible to assess to what degree the annual objectives are achievable.
2- Pipe Gen Dashboard
Intended for: Sales Managers, Sales Reps
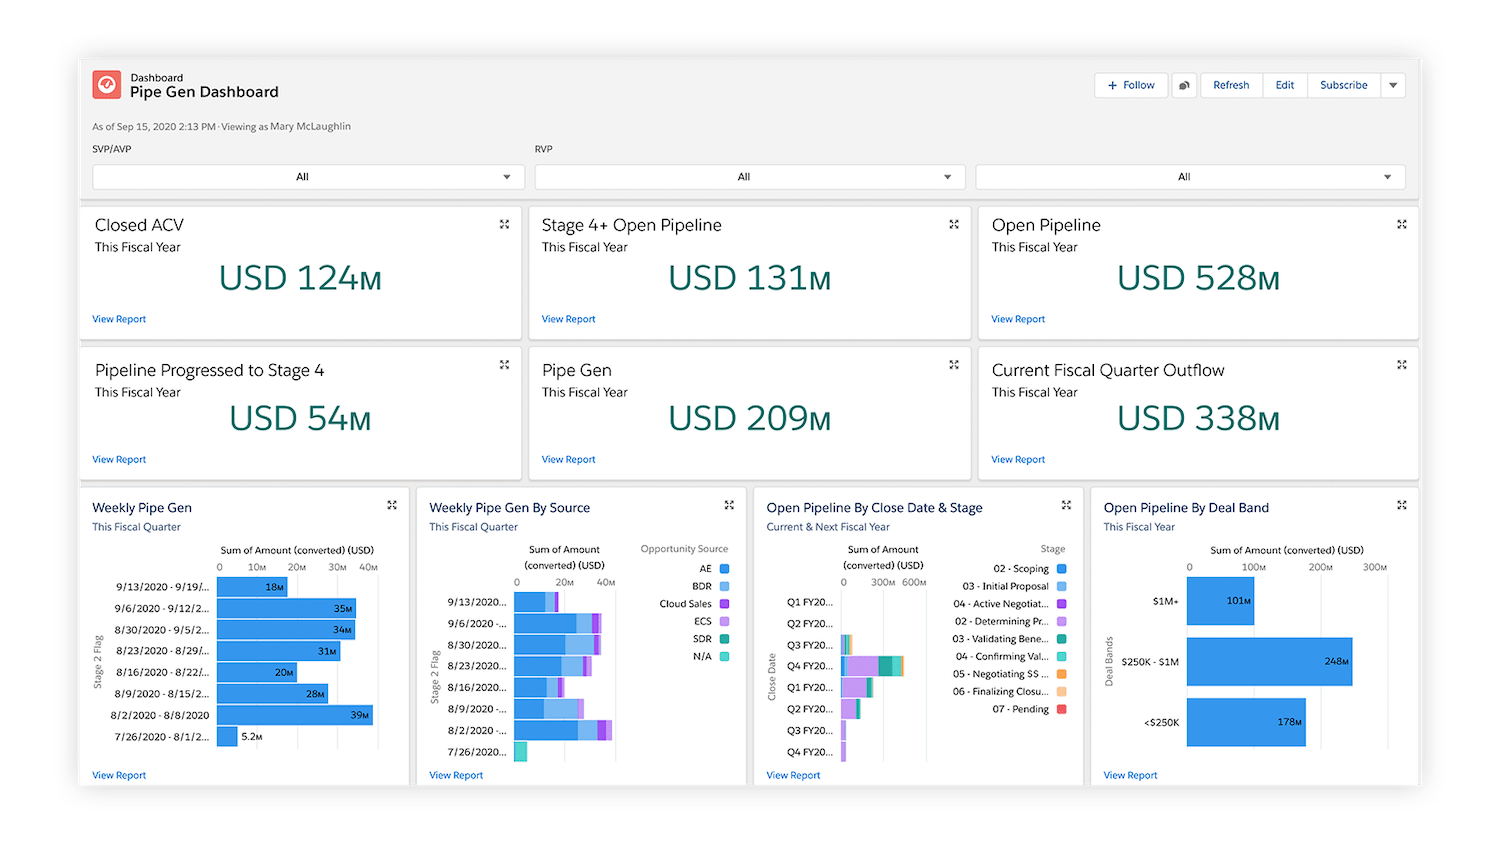
This panel offers comprehensive information on the sales flow using status and trend metrics, both for general sales volume and by periods and sources. The component of the flow found in Stage 4 stands out for its importance due to how near it is to progressing forward to close the sale.
This dashboard, based on your weekly flow, allows you to spot underperforming pipelines early in the sales cycle. With everything previously mentioned and by taking advantage of the structure of market segments, the need to introduce new commercial strategies can be inferred.
3- Forecast Dashboard
Intended for: Sales, Finance, Executive teams
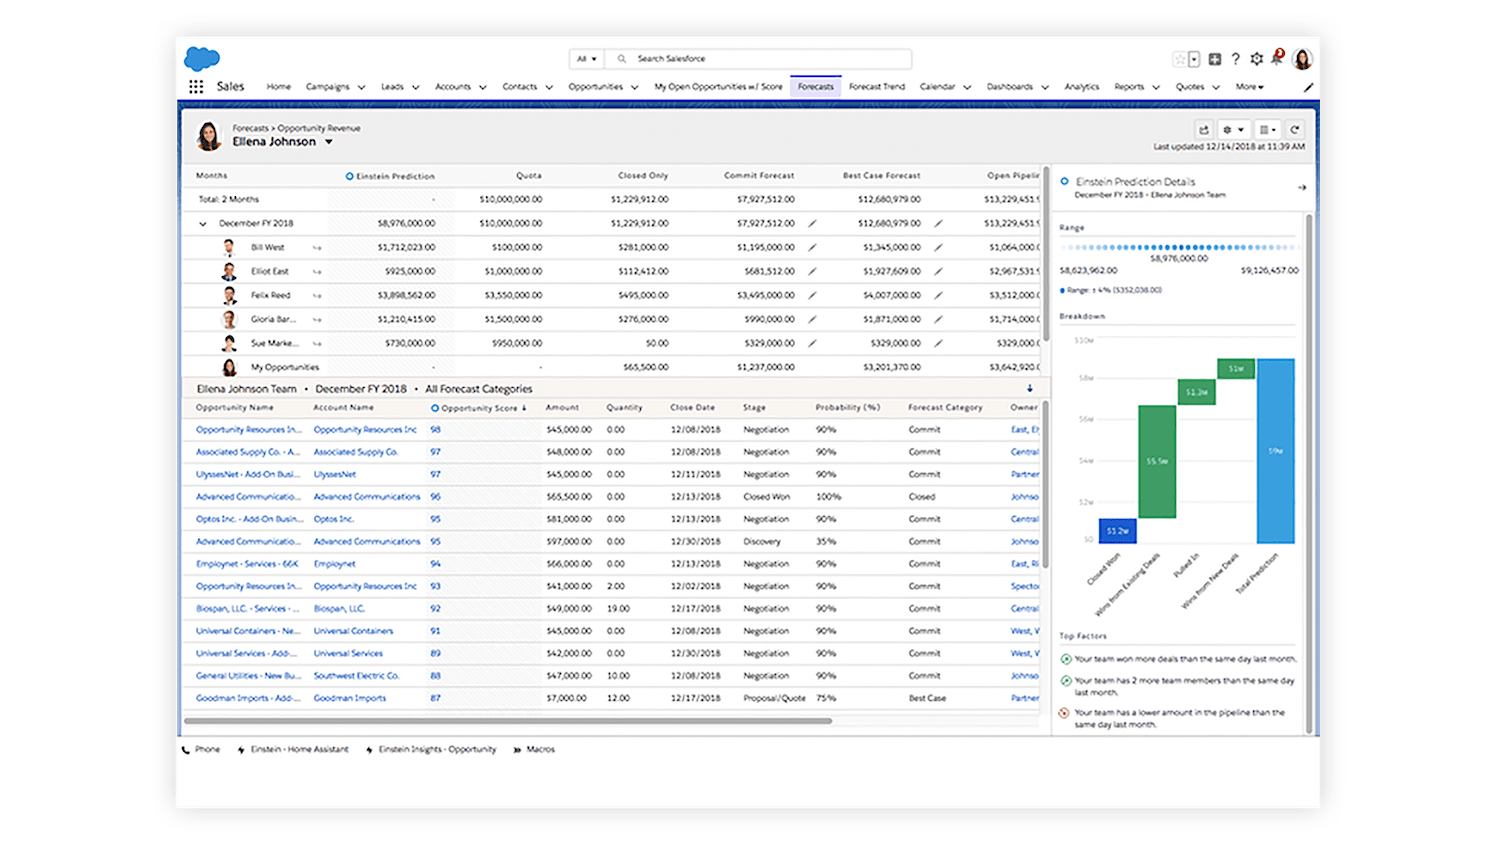
This dashboard provides a clear picture of sales forecasts by generating a range of probabilities based on Einstein Analytics. This allows for planning the sales cycle and managing expectations in the medium term. The monitoring of sales forecasts can help to identify failures or risks in the commercial flow, as well as the ability to make accurate and timely decisions. For example, if the sales forecast is low, new commercial strategies can be introduced in order to achieve the set objective.
The key metrics for this dashboard are sales quotas and quota achievement rates. To do this, it uses various underlying reports to make multiple forecasts: by employees, by representatives, by team, by stage, or by territories. The panel is also beneficial for sellers whose commission is based on their revenue performance. A quick look at the forecast will allow an individual to know how their current performance will affect their compensation.

Need Salesforce Consulting Services?
We offer Salesforce consulting services aimed to kickstart your company’s growth, either by implementing a new business-tailored solution or improving an existing implementation.
4- Top Performing Customers Dashboard
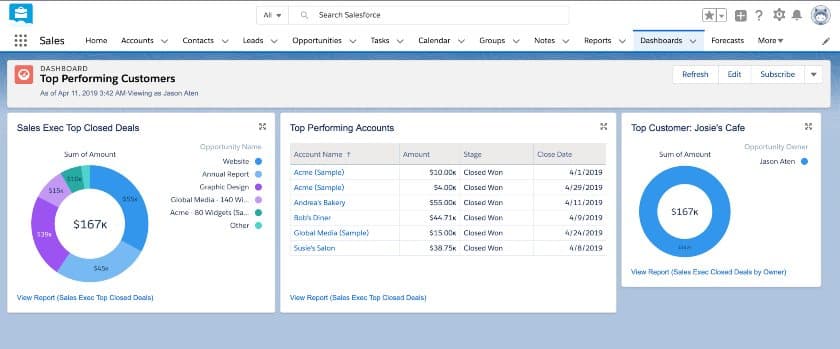
Intended for: Sales Managers, Executives, Business owners
This panel helps identify which customers have the highest share within the company’s sales structure. It offers a breakdown of the main deals closed, the accounts with the greatest impact, and highlights the best client. This makes it possible to more effectively project both special offers and representation expenses towards these clients with the aim of achieving and preserving their loyalty.
5- Sales Rep’s Dashboard
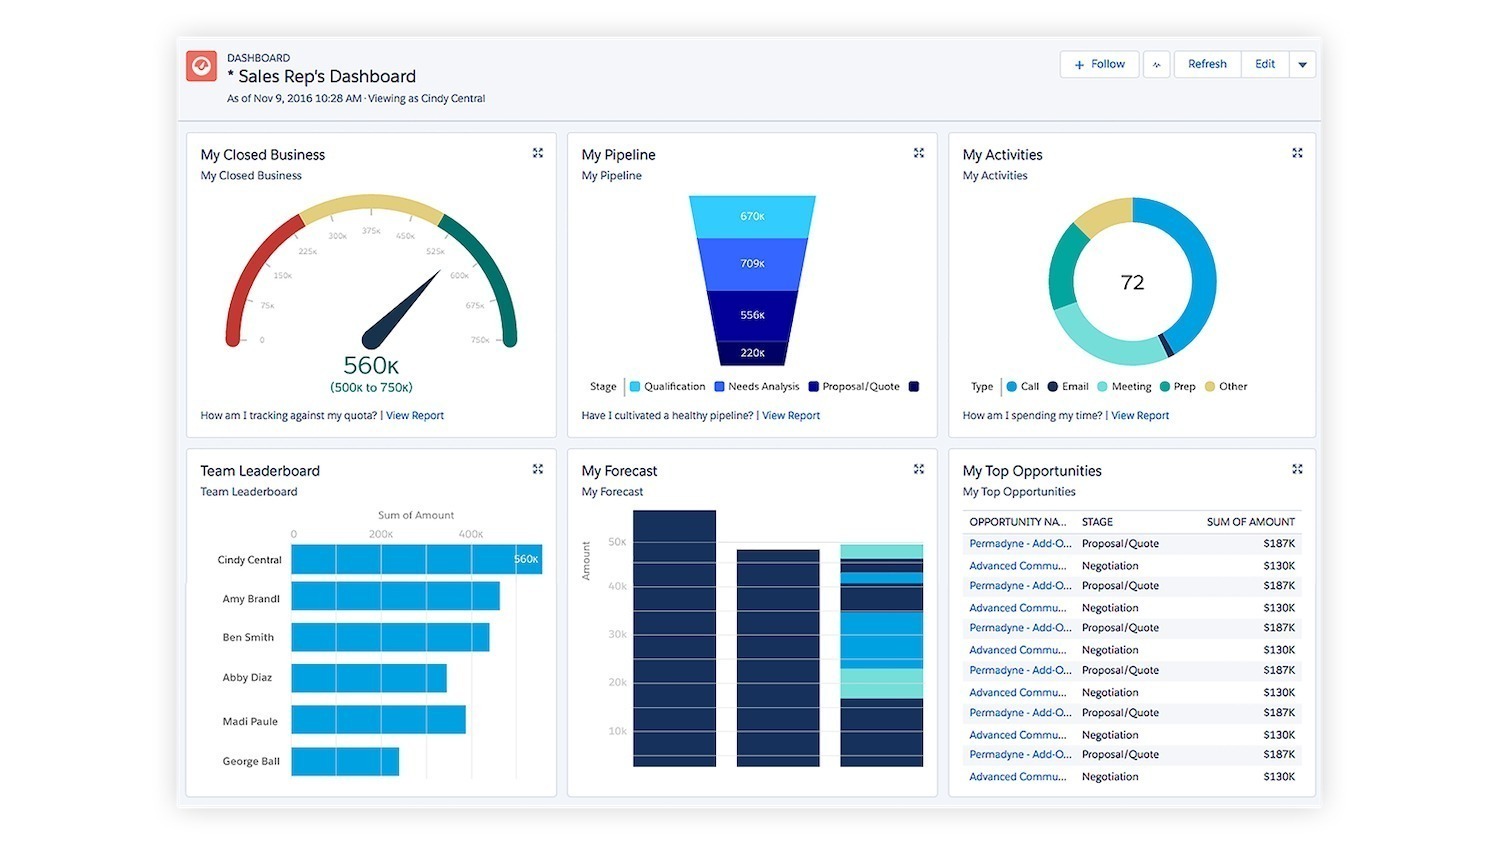
Intended for: Sales Reps
The panel makes the performance of a sales representative visible in real time. First, it shows the structure of your activities by type, your position within the team, your forecast for each state, and your best opportunities by state and volume. All this allows you to properly organize and prioritize your personal activity.
6- My Team Performance Dashboard
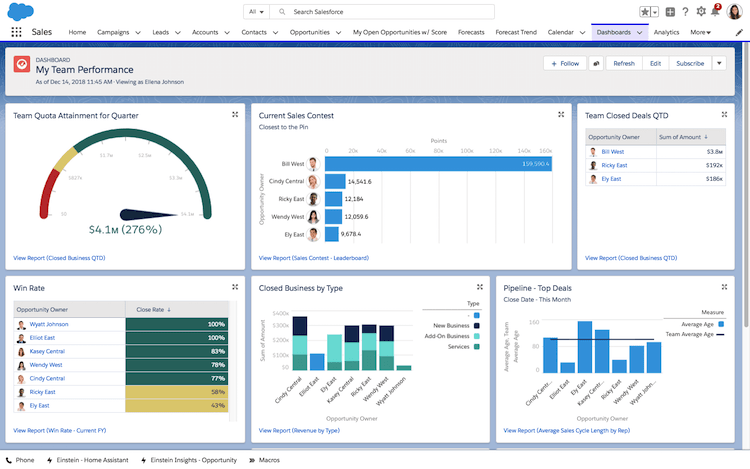
Intended for: Managers, Sales Executives
It evaluates the dynamics and effectiveness of the team in closing deals which, without a doubt, is a high-value metric. It comparatively shows the results of each member by the volume of sales and deals closed by different categories. This makes it easy to organize the workflow for sales reps and monitor it for managers.
7- Competitive Dashboard
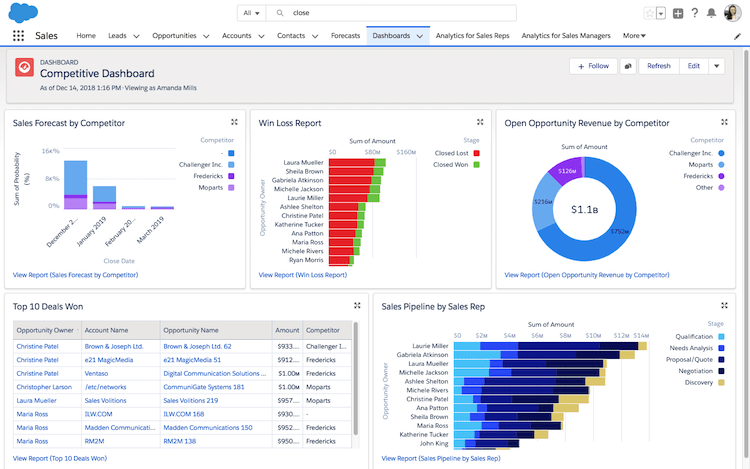
Intended for: Managers, Sales Executives
If you trust healthy interpersonal competition as a promoter of success, this panel may be one of your favorites. The objective is to encourage the increase in commercial flow and achieve the highest income in a given period. The metrics to display are the following: sales forecast, deal closing efficiency, open opportunities by income level, top 10 closed deals, and a sales pipeline for each representative and negotiation stage. All at the individual comparative level!
In short, Salesforce dashboards are useful tools for sales teams and business owners. Through the centralization of reports and basic metrics, they show, in a compact way and in real time, the general state of an organization. In this way, they influence the making of accurate commercial decisions.
Managing the dashboards, until they are optimized for your needs, can be complex. If you need advice and suggestions to customize them, do not hesitate to write to us at hello@theskyplanner.com. We can help you.
