The time has come. Your business begins to ask questions, and the data you have collected has the answers. You need information to help you make decisions and prevent requested reports from taking too long:
- What has been the total weekly income?
- Which region had the highest income?
- What has been the best-selling product?
A report is formed from the selection of a group of records included in a database. Filters and formulas are applied to this selection to answer the questions you have asked yourself. Included in the license price, Salesforce provides tools that allow you to create reports that you can represent in different ways through dashboards. In this article, we will show you some basic aspects that can guide you in this world of Salesforce reports and dashboards.
Creating reports in Salesforce
When creating a report in Salesforce, you must enter the report’s name, enter a description, select a type of report, select the format, etc. Reports are always created within folders. You can move the reports that you have created from one folder to another. Additionally, you can also modify, delete, or copy these reports. Depending on the permissions applied to these folders, other users may be able to perform these actions as well. You could also schedule the execution of these reports to be displayed or sent at a certain time.
Report types
The different types of reports can be seen as templates that you can use to visualize your data more easily. These reports are based on relationships between objects: the main object and the other objects related to it. For example, in the case of a “Contacts and Accounts” report, “Contacts” is considered the main object while “Accounts” is the related object. In a report type, a parent object can be related to up to three child objects. They also have defined a selection of fields that they can display.
There are two types of reports in Salesforce:
- Standard reports: Salesforce offers a great variety of these reports (activity, administrative, campaign reports). It will be very rare that you would not find one that matches what you need.
- Custom reports: These allow you to create your own templates from the custom objects or the custom views of standard objects and their relationships. In addition, you can also select the fields you want to show as you like.
Format Reports in Salesforce
Among the formats that you can find in the Report Builder menu are:
Tabular
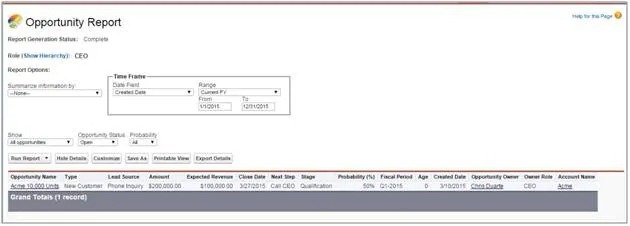
An ordered set of fields in columns, with each matching record numbered in a row. Tabular reports are best for creating lists of records or a list with a single grand total.
Summary
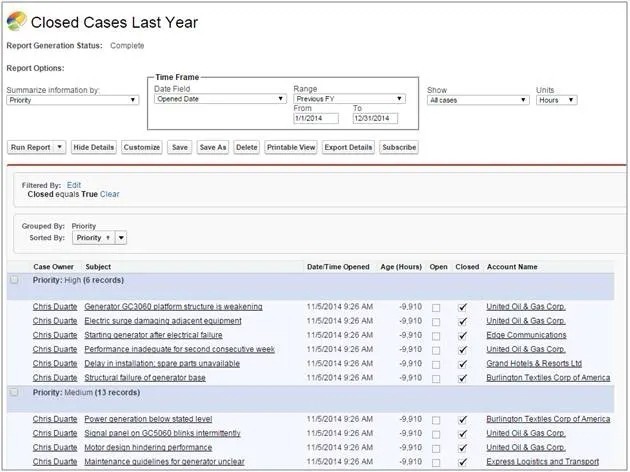
Reports in this format allow users to group rows of data, view subtotals, and create charts. They can be used as a source for panel components.
Matrix
Useful for grouping and summarizing data by rows and columns. They can be used as a source for panel components.

Joined
It can contain data from various types of reports (both standard and custom) and up to five report blocks.
Dashboards
A dashboard allows you to view your reports in a friendly and summarized way. These resemble the slates in a command post . They can quickly and easily show the status of critical elements and key indicators for your company.
Once the Dashboard Builder is launched, you will be able to insert different types of components into your dashboard:
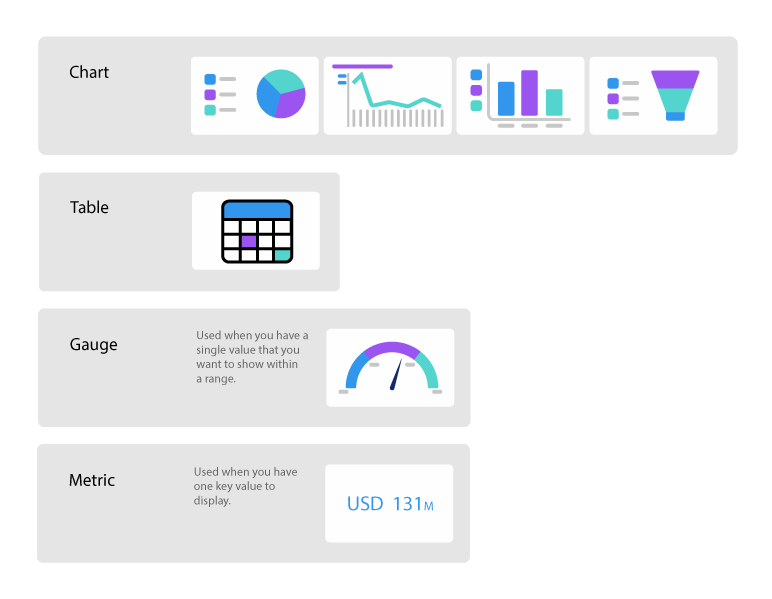
Some other types of components are the Visualforce Page and the Custom S-Control. The first allows you to display data from an external system or display data from Salesforce in a custom way. In the second, you can insert any type of content that can be displayed in a browser.
Each component may represent a single report. However, you can use the same report in multiple components.
Standard dashboard on Salesforce
Salesforce makes your job easier by offering you a wide variety of standard dashboards, geared towards both sales & marketing and services. All of them are designed to increase efficiency and accelerate business productivity.
Here are examples of standard dashboards and reports:
| Department | Dashboard | Report | Description |
|---|---|---|---|
| Sales | State of the Union | Closed Business | Provides a bird’s-eye view of a company’s performance. |
| Sales Pipeline | |||
| Month Over month growth | |||
| Forecast by month | |||
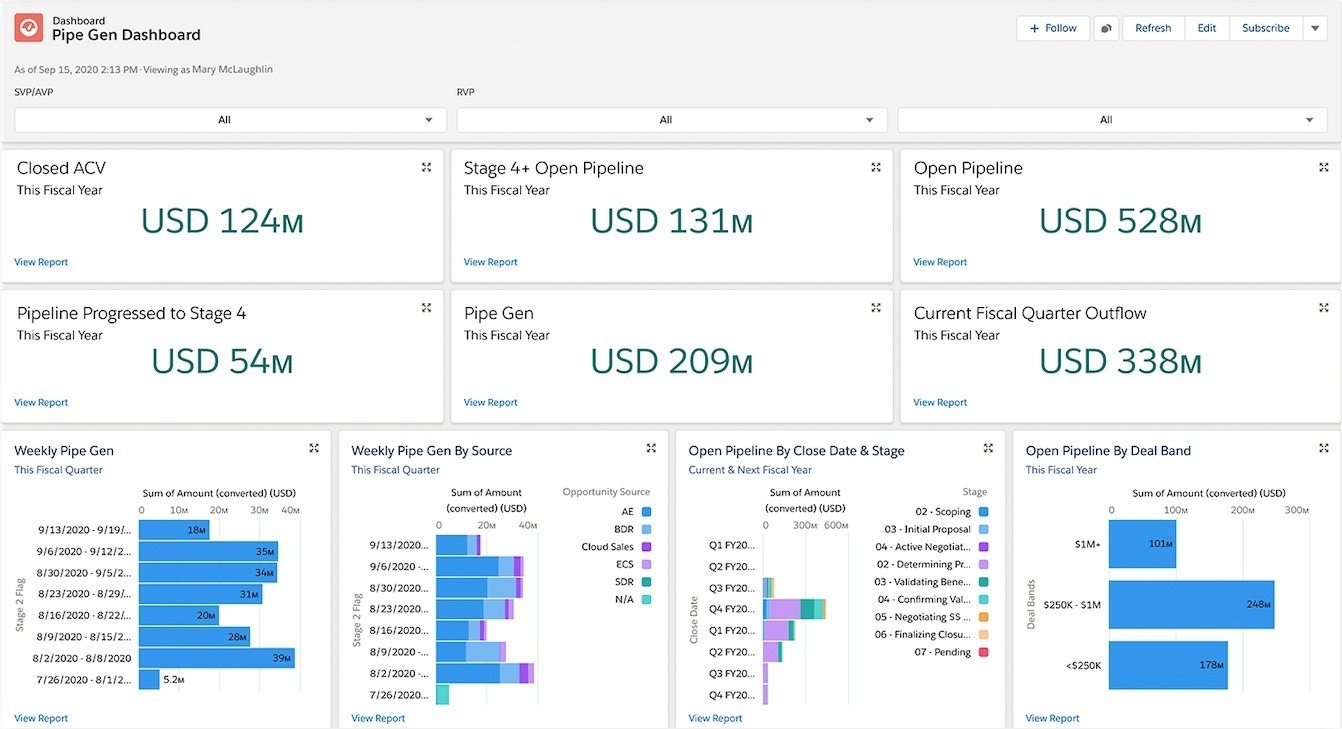
| Pipe Gen | Closed ACV (Annual Contract Value Closing) | Useful for anticipating problems related to meeting sales revenue growth targets. | |
| Open Pipeline | |||
| Open Pipeline by Closing Date & Status | |||
| Current Fiscal Quarter Outflow | |||
| Activity Management | Lead Status by Owner | Helps you identify where your sales team could better spend their time and resources. | |
| Pipeline and Revenue Sourced from Market | |||
| Campaign revenue – Expected vs. Actual | |||
| Open Pipe Gen | Open Pipe by State | With it you can monitor the growth of your pipeline. | |
| Open Pipe Next Month | |||
| Pipe by Product | |||
| Open Pipe by Product | |||
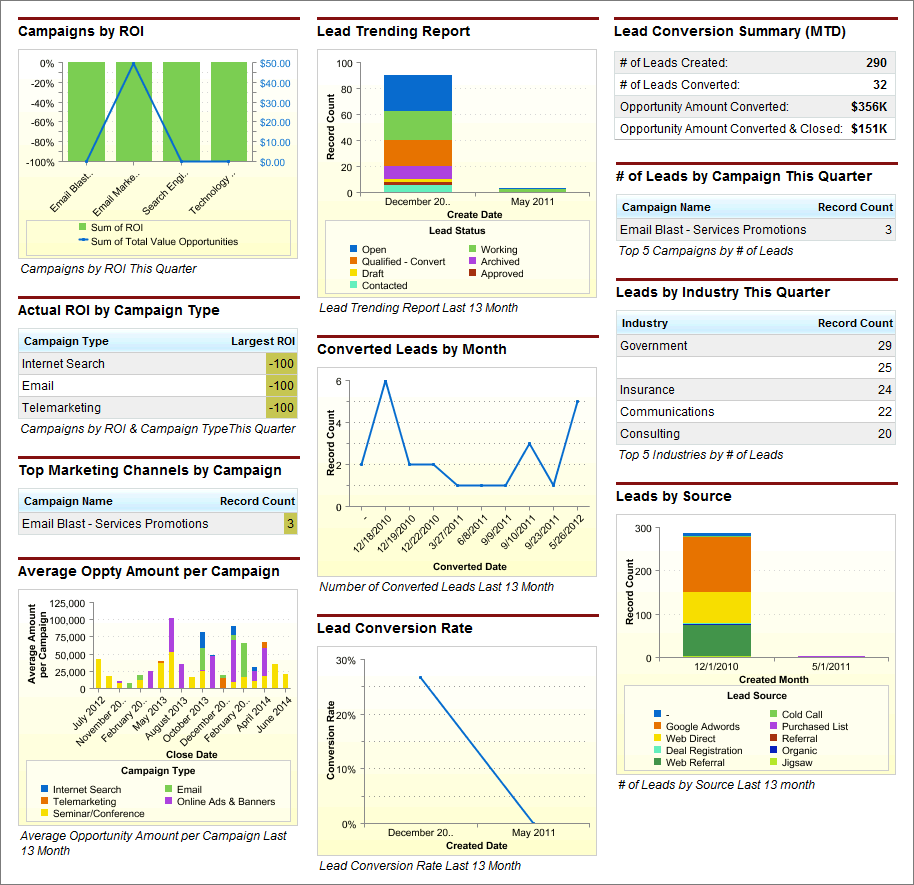
| Marketing | Marketing Executive | Campaigns by ROI | Marketing executives can use this dashboard to find out if they are creating efficient campaigns and generating and converting leads. |
| Lead Trending Report | |||
| Lead Conversion Summary | |||
| Actual ROI by Campaign Type |
Some limitations in working with Salesforce reports
- Depending on the license, the limit for monthly customizable reports varies. For example, with Professional 50 and Enterprise 200.
- Achieving great results when you have little experience working with data in Salesforce can be very labor intensive and time consuming.
- Combining SFDC (SalesForce Dot Com) data with external data can be extremely complex, although not impossible if you have good advice.
- Each user can only subscribe to follow up to 5 reports and 5 dashboards at most. However, more than this is needed in very few occasions.
In general, native Salesforce reports are useful for small businesses without high demands on Business Intelligence (BI). They are used to perform pipeline analysis, basic sales productivity metrics, and real-time information if you would like. They are, however, weaker in historical and trend comparisons.
Managing Reports in any organization can be quite complex. If you need advice, do not hesitate to contact us by sending an email to hello@theskyplanner.com. We can help you.
